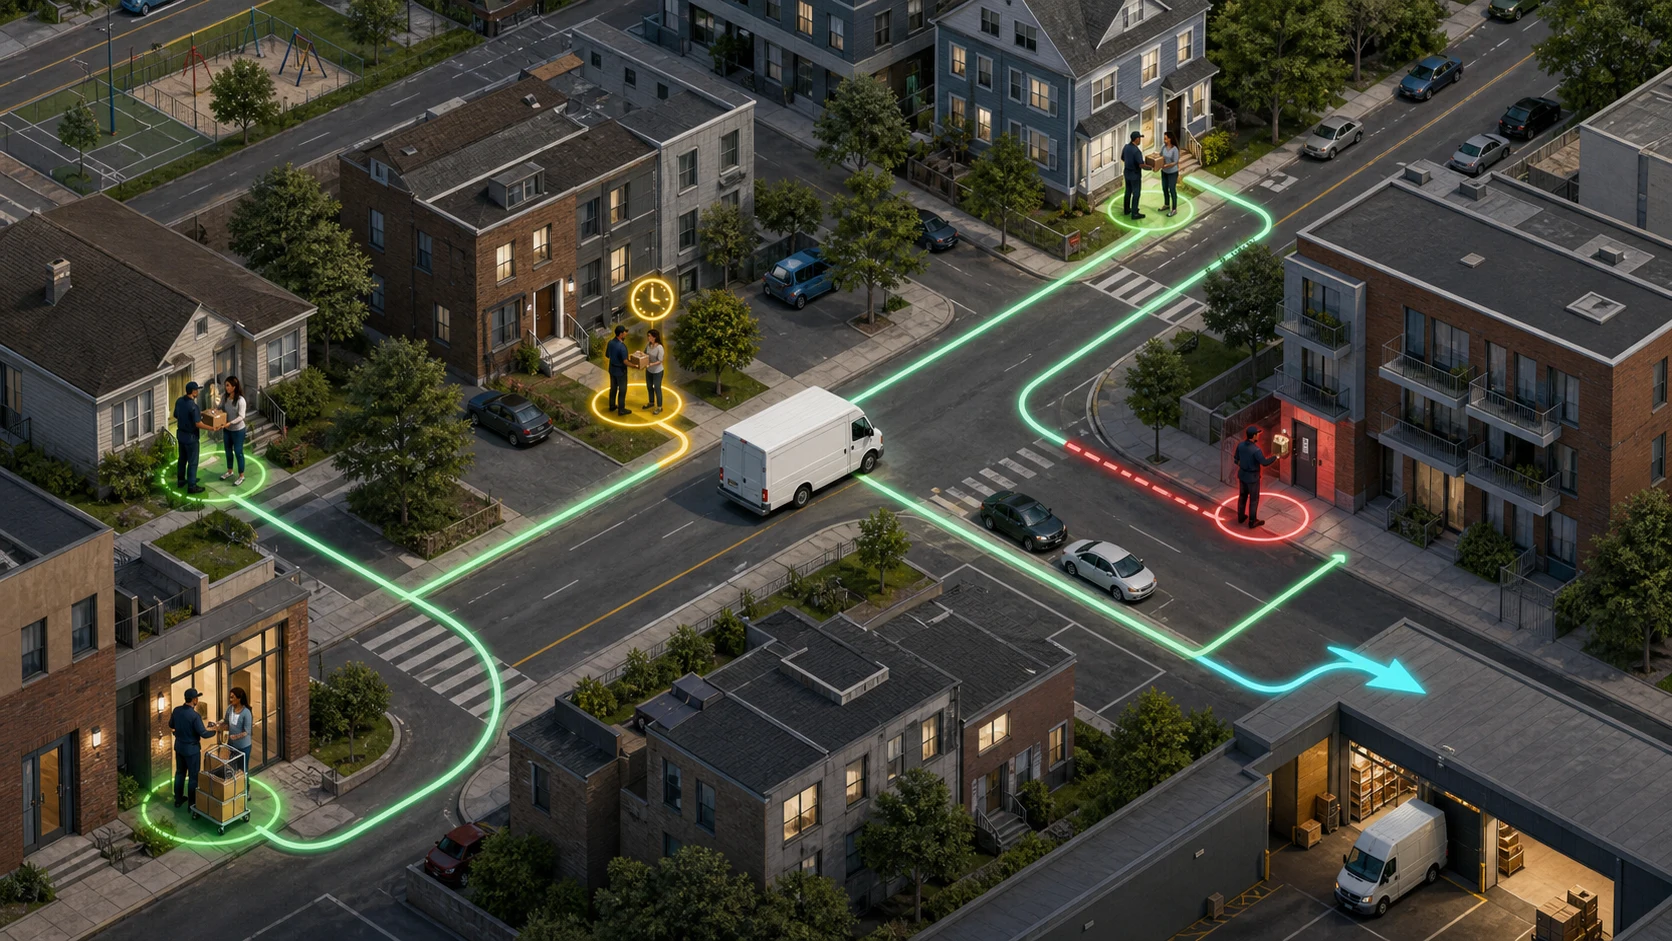
Last-mile cost is largely designed upstream through delivery windows, stop density, service time, first-attempt success, and returns—not discovered after a carrier submits a rate.
Last-mile delivery is often sourced backward. A retailer defines free delivery, narrow windows, signatures, room-of-choice service, or easy returns. Then transportation is asked to find a carrier that can make the economics work.
By that point, much of the cost is already designed.
The last mile converts a regional pool of orders into individual service events. Its economics depend on how many successful service events a route can complete with a given amount of driver time, vehicle time, distance, and exception work. The carrier matters, but so do the promise, order geography, package, building access, customer data, and upstream fulfillment process.
The practical rule is:
Define the service promise and model its operating consequences before buying capacity. Price a successful delivery and its exception path—not just a package tender.
Model the last-mile cost drivers per successful delivery
“Cost per stop” is useful only when everyone agrees on what the stop includes. A quoted stop may exclude linehaul injection, sortation, wait time, signature, stairs, oversized handling, failed attempts, returns, peak surcharges, or customer service.
Build a full cost bridge:
origin handling and injection
+ destination sort or cross-dock
+ route-start fixed cost
+ driver and helper time
+ vehicle time and distance
+ delivery service time
+ access, parking, toll, and curb cost
+ technology and dispatch
+ failed-attempt and recovery cost
+ returns and reverse-logistics cost
+ damage, loss, claims, and customer-service cost
+ peak and contingency capacity
------------------------------------------------
successful deliveries
This is not a universal rate formula. It is a management view that stops one low line item from hiding work performed elsewhere.
Track both planned cost per successful delivery and actual cost per successful delivery. The variance should reconcile to volume, density, route, dwell, failure, return, claim, and capacity differences—not disappear into a monthly invoice total.
Use the freight-pricing architecture to separate the linehaul, fuel, minimum, and accessorial terms in a provider's invoice from the internal station, service, recovery, and customer-care costs in this full cost bridge.
The delivery promise is an operating specification
“Two-day delivery” describes elapsed time. It does not tell an operator:
- when the order is released;
- whether inventory is physically available;
- what time the destination route receives it;
- whether the recipient chooses a time window;
- whether service is unattended, signature-required, threshold, room-of-choice, or installed;
- how many attempts are included;
- whether weekends or holidays count;
- what happens when the customer is unavailable;
- whether an appointment is a target or a guaranteed commitment;
- when a shipment becomes late;
- which exceptions pause the clock.
Translate customer language into an operating specification before the RFP.
For consumer orders, distinguish a seller's promise to ship from a carrier's promise to deliver. The Federal Trade Commission's Mail, Internet, or Telephone Order Merchandise Rule guide addresses when sellers must ship merchandise or seek consent to delay; it should not be misquoted as a universal last-mile transit guarantee. Marketing, fulfillment, transportation, and legal teams need one agreed definition for the customer-facing promise.
Every additional constraint consumes route flexibility. Narrow windows can separate nearby stops into different route positions. A signature requirement can turn an efficient doorstep release into wait time and a second attempt. Same-day cutoffs reduce consolidation time. Room-of-choice service adds parking, access, handling, and sometimes a helper.
The right question is not whether customers value the service. It is whether the margin, fee, retention benefit, or strategic promise pays for the operating shape it creates.
Density is more than orders per ZIP code
Delivery density determines how much productive service can fit between the route stem and the driver's available hours. But a single density number hides important differences.
Measure:
- stops per route square mile;
- packages or units per stop;
- distance from station to first stop and last stop back to station;
- distance and drive time between stops;
- stops per paid route hour;
- service time by building and service type;
- route-volume consistency by day of week;
- pickup and return density;
- delivery-window overlap.
Ten packages to one loading dock are not ten residential stops. Fifty apartment deliveries can be dense on a map but slow if access, elevators, unit navigation, and parking add service time.
Research has long shown that customer density and delivery-window design interact. A peer-reviewed study in the Journal of Business Logistics found materially different route efficiency under narrow attended windows versus broad unattended service; the durable point is the tradeoff, not a universal percentage for every network. See Boyer, Prud'homme, and Chung's study of density and delivery-window patterns.
Segment economics by operating archetype:
- dense residential parcel;
- suburban residential;
- rural residential;
- urban high-rise;
- small commercial;
- scheduled dock delivery;
- bulky or two-person home delivery;
- regulated or age-verified delivery;
- reverse pickup.
A blended average can make a profitable core subsidize an unpriced tail.
Service time is often the hidden constraint
Route optimization focuses attention on drive sequence. At the last mile, much of the route can be consumed after the vehicle reaches the destination.
Service time may include:
- finding legal or workable parking;
- walking from the vehicle;
- locating an entrance, suite, dock, or unit;
- security or concierge check-in;
- waiting for a recipient;
- scanning, photographing, signing, or collecting payment;
- unpacking, assembly, installation, or removal;
- managing refused, damaged, or undeliverable product;
- returning to and securing the vehicle.
FHWA's urban freight delivery primer describes curb competition and the role of loading-zone supply, permitting, and enforcement. A route plan that assumes every stop has immediate curb access is not merely optimistic; it prices a different service.
Capture service-time percentiles by stop type. An average can hide the long tail that causes later appointments to fail. Use at least median and high-percentile dwell, then identify the attributes behind the tail: building, product, time window, daypart, customer type, parking condition, and service level.
Do not discipline drivers for accurate dwell data. If the operating system rewards artificially short stop times, the model will keep selling capacity that does not exist.
First-attempt success starts with order data
A failed attempt is not only an extra drive. It can create:
- exception handling and customer contact;
- re-sort and re-route work;
- a second linehaul or station cycle;
- inventory aging or temperature exposure;
- refund, cancellation, or chargeback risk;
- return-to-sender cost;
- an additional opportunity for damage or loss.
Many failure controls belong upstream:
Validate the destination
Standardize address elements before label creation using a controlled convention such as the USPS Postal Addressing Standards, then validate the result. USPS explains that Delivery Point Validation can confirm whether a ZIP+4-coded address is represented in its delivery file as a known address record. A valid postal delivery point still does not prove that a private carrier has complete apartment, dock, access-code, or geolocation details, so collect those separately.
Confirm the service condition
Ask for unit, suite, business name, dock hours, contact, gate code, signature availability, equipment restrictions, and safe-place instructions where appropriate. Validate phone and email fields before tender.
Communicate a usable window
An ETA that changes silently is not an appointment system. Define when the customer is notified, how the window narrows, what response is needed, and how the carrier handles a no-response.
Offer an economically coherent alternative
Pickup points, lockers, alternate dates, broader windows, or unattended delivery can increase first-attempt success for the right product and customer. They also introduce custody, capacity, convenience, and security tradeoffs. Test them by segment rather than presenting them as universal fixes.
Control exception reason codes
“Customer unavailable” should not absorb bad addresses, inaccessible buildings, late routes, damaged product, missing equipment, or a carrier decision not to attempt. Require evidence and a reason taxonomy that supports corrective action.
Match the capacity model to the volume shape
There is no universally best last-mile capacity model.
| Model | Where it can fit | Exposure to test |
|---|---|---|
| Owned fleet | Stable core volume, differentiated service, high control requirement | Fixed cost, management depth, seasonal underutilization, geographic tail |
| Dedicated fleet | Predictable volume with specified assets, labor, and service | Minimum commitments, change control, productivity assumptions, pass-through costs |
| Common parcel network | Standardized parcels, broad coverage, scalable injection | Surcharges, claim limits, scan logic, peak rules, service exceptions |
| Regional last-mile carrier | Concentrated geography or specialized local service | Coverage edges, subcontracting, technology, financial resilience, peak capacity |
| Brokered or managed network | Fragmented markets, multi-provider coordination | Identity control, service consistency, data normalization, margin layers |
| On-demand or crowdsourced capacity | Volatile local needs and short lead times | driver vetting, insurance, custody, regulated goods, customer experience |
Many networks need a portfolio: stable core capacity, scalable standard coverage, and a priced exception layer. The mistake is letting the exception layer become the default without revisiting the promise.
Use the motor-carrier vetting framework for providers operating regulated commercial-motor-vehicle service, then add last-mile-specific controls for drivers, subcontracting, custody, customer contact, proof of delivery, and access to homes or controlled facilities.
Give bidders a data pack they can price
A last-mile RFP built from annual shipments and average weight invites risk pricing and later disputes. Supply enough operating detail to expose the work:
- origin facilities, induction times, and sort requirements;
- daily volume by destination geography and day of week;
- peak-day and peak-week factors;
- packages or units per order and per stop;
- dimensions, weight, handling units, and product constraints;
- residential, commercial, high-rise, and rural mix;
- service levels and delivery-window distribution;
- signature, age verification, proof-of-delivery, unpacking, assembly, and removal needs;
- historical service time and attempt outcomes;
- appointment and customer-notification process;
- returns, exchanges, refusals, and reverse-pickup volume;
- claims and damage profile;
- regulated, temperature-sensitive, high-value, or hazardous goods;
- system interfaces, scan events, images, and data-retention needs;
- proposed launch geography and ramp.
Ask each provider to state assumptions and exclusions against the same baseline. A rate without its operating assumptions is not comparable.
If inventory deployment and order release are causing route instability, include the warehouse or fulfillment operator in the design. The warehouse and 3PL selection guide addresses the upstream process and systems questions that last-mile teams often inherit too late.
Contract the event definitions and data
The contract should define more than price and “on-time.”
Specify:
- tender accepted;
- received at destination facility;
- out for delivery;
- attempted;
- successfully delivered;
- delivered late;
- refused;
- damaged;
- customer unavailable;
- inaccessible;
- returned to station;
- return initiated and completed.
For each material event, define the timestamp source, location or geofence rule, scan requirement, acceptable proof, correction process, and data-delivery latency.
Address:
- subcontractor disclosure and approval;
- driver and vehicle standards;
- customer-data use and retention;
- photo and signature controls;
- claim limits and filing process;
- unauthorized safe-drop rules;
- change-of-address controls;
- high-value and regulated-goods procedures;
- peak commitments and forecast tolerance;
- invoice audit data;
- termination assistance and data export.
When damage, shortage, or loss occurs, the operating record should feed a disciplined freight-claims process, not a customer-service inbox with no custody evidence.
Use a scorecard that shows the economic engine
The scorecard should connect customer outcome to route behavior and cost:
Economics
- cost per successful delivery;
- cost per attempted stop;
- cost per order, unit, or package;
- accessorial cost per successful delivery;
- peak premium and contingency-capacity use;
- return and redelivery cost.
Productivity
- stops per paid route hour;
- packages or units per stop;
- route miles and drive time per stop;
- median and high-percentile service time;
- station dwell and route departure adherence.
Service
- first-attempt success;
- on-time performance against the actual promise;
- delivery-window compliance;
- proof-of-delivery completeness;
- exception-notification latency;
- complaint and damage rate.
Control quality
- valid-address and complete-instruction rate;
- reason-code accuracy;
- unauthorized subcontracting or identity exceptions;
- claim-file completeness;
- data timeliness and reconciliation;
- corrective actions closed and repeated.
Review by geography, service type, building type, carrier, and customer segment. A national aggregate can look stable while a route family destroys margin and trust.
Operating takeaway
Last-mile economics are the output of a service design. Density, route stem, dwell, customer availability, physical access, package characteristics, returns, and evidence requirements determine how much work fits into a route.
Define the promise in operating terms. Segment the geography. Price successful delivery and recovery work. Give carriers real data. Contract the event definitions. Then use the scorecard to decide whether the promise, process, or provider needs to change.
The most effective last-mile procurement decision may be a different carrier. It may also be a broader window, better address data, a different fulfillment node, or an honest price for an expensive service.
Place the service promise within the broader operator's map of how freight moves across America, then use UniteCargo's last-mile provider listings to identify candidates for the same data-backed operating test.
Sources and further reading
- FHWA: Primer for Improved Urban Freight Mobility and Delivery
- USPS PostalPro: Delivery Point Validation
- USPS: Postal Addressing Standards and Address Information Systems
- Federal Trade Commission: Mail, Internet, or Telephone Order Merchandise Rule
- Boyer, Prud'homme, and Chung: Customer Density and Delivery-Window Patterns